Faculty Research Gallery

Research Gallery

AUTOMATED HIGH-DENSITY RECORDING ELECTRODES TO PROBE THE ORGANIZATION OF VISUAL CORTEX

Automated high-density recording electrodes to probe the organization of visual cortex. Each red dot overlaid on a rat brain represents a recording site on a silicon micro-machined electrode array implanted under robotic control. These electrodes allow the activity of visual cortical neurons to be measured, allowing the computational organization of visual processing in cortex to be probed.

Source: Cox Lab

BUDDING YEAST CELLS IN A GRADIENT OF PHEROMONE

“Budding yeast haploid cells exist as two sexual types, called MATa and MATalpha. They can attract each other to mate by producing specific pheromone. This production of pheromone can be detected by cells which then form a mating projection, called a shmoo, in the direction of their mating partner. When two shmoos reach one another, the two cells fuse and produce a diploid cell. Here a MATa cell was exposed to a spatial gradient of alpha factor (imaged in red), the pheromone normally emitted by the MATalpha cells. This artificial gradient was produced using synthesized alpha factor flown in a “”two phases laminar flow chamber””, the MATa cells being attached on a coverslip closing the chamber. In green is shown the localization of the MAP kinase Fus3, specific for the pheromone response pathway, coupled to a yellow fluorescent protein, YFP. This MAP kinase is usually concentrated only in the nucleus and relocates at the tip of the mating projection when cells polarize and grow in the direction of a pheromone gradient.”

Source: Murray Lab

CALYX OF THE MUSHROOM BODY, DROSOPHILA BRAIN

“A laser scanning confocal micrograph of an approximately 15 micron field in the brain of Drosophila. The region shown is the “calyx of the mushroom body”, a region of interest because its synapses have been implicated in memory storage. The image shows these synapses in red and green. Each of the round or oval fluorescent shapes is a synaptic site, specifically a “pre-synaptic bouton”. The red fluorescence is the protein choline acetyltransferase, which synthesizes the neurotransmitter acetylcholine in the pre-synaptic zone of the axon terminal. The green fluorescence is the fluorescent protein EYFP, which is localized to the same pre-synaptic zones.

The mechanism of this localization relates to our current publication, because it is due to 3’UTR sequences on the mRNA from which it is synthesized. The mRNA is localized to the synapses, and translated into protein there.”

Source: Kunes Lab

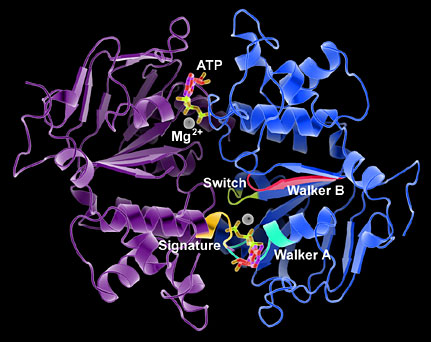
CRYSTAL STRUCTURE OF A TAP CYTOSOLIC DOMAIN WITH ATP

The TAP transporter uses the energy from ATP binding and hydrolysis to pump short peptides from the cytosol into the endoplasmic reticulum. These peptides are then loaded on class I MHC molecules and presented to the immune system for detecting virus infection or cancer. The Gaudet lab uses a combination of structure determination and biochemistry to understand how TAP undergoes important conformational changes during a catalytic cycle.

Source: Gaudet Lab

DETECTING BIOPOLYMER CHARACTERISTICS IN A NANOPORE

“Solid state nanopores are fabricated by closing 100 nm diameter pores down to single digit nanometer dimensions using ion-beam sculpting. When a polymer, such as DNA, is drawn through such a nanopore, the electrical properties of the nanopore are altered in a manner that reflect the DNA length, the way it is folded on itself, and other structural features. Eventually, we hope to develop nanopores into sensing elements that can provide high speed DNA sequence information.”

Source: Branton Lab

FLUORESCENT E. COLI

“Cells of Escherichia coli labeled with an amino-specific Alexa Fluor dye, de-energized by exposure to light, and examined in a fluorescence microscope. By using pulsed light (strobed laser illumination at a smaller average intensity) and an ordinary CCD camera, one can see what flagella do as swimming cells run and tumble. See Turner, L., Ryu, W.S. & Berg, H.C. Real-time imaging of fluorescent flagellar filaments. J. Bacteriol. 182, 2793-2801 (2000).”

Source: Berg Lab

FLUORESCENT IN SITU HYBRIDIZATION TO EMBRYO NUCLEI OF THE BDELLOID ROTIFER PHILODINA ROSEOLA

“Eleven nuclei (blue) from an embryo of the bdelloid rotifer Philodina roseola, hybridized with fluorescent probes prepared from cosmids containing approximately 40 kb of genomic DNA. P. roseola has four copies of the hsp82 gene; this image shows fluorescent in situ hybridization (FISH) with copy 3 (red) and copy 4 (green). Each probe hybridizes preferentially to only a single site in each nucleus, demonstrating the absence of nearly-identical alleles of each gene. Image by Jessica Mark Welch.”

Source: Meselson Lab

FLUORESCENTLY-LABELED MIDBRAIN DOPAMINE NEURONS AND THEIR SPIKES

Midbrain dopamine neurons respond to unpredicted rewards. They are thought to broadcast “reward prediction error” signals that act as a teaching signal for reward-based learning.

Source: Uchida Lab

FORMATION OF A TOPOLOGICALLY COMPLEX POSTSYNAPTIC APPARATUS IN A MOUSE

“Neurotransmitter receptors added to a synaptic membrane at three different times are labeled with three different colors (red, green, blue) . The differences reveal the way in which the synapse grows. Image by T. Kummer.”

Source: Sanes Lab

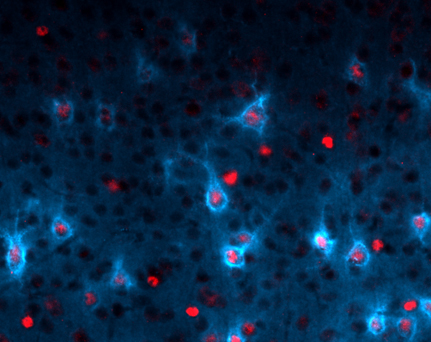
GABA NEURONS CONTROLLING BRAIN PLASTICITY

Fast-spiking GABA neurons coordinate critical periods of circuit refinement in the early postnatal neocortex. Otx2 homeoproteins (red) control the maturational state of these pivotal cells, which acquire a peri-neuronal net (blue) that limits plasticity with age. This parvalbumin network is particularly vulnerable in mental disorders.

Source: Hensch Lab

MOLECULAR BIOLOGY OF PHEROMONE DETECTION IN THE MOUSE

“In mammals neurons from the vomeronasal organ (VNO) are specialized in detecting pheromones, and in providing the brain with sensory information leading to reproductive and aggressive behaviors. Depicted here is the expression pattern of surface molecules involved in the process of pheromone detection: a member of the V2R family of pheromone receptor (red), and a member of the M10 family of non-classical class I MHC genes (green).”

Source: Dulac Lab

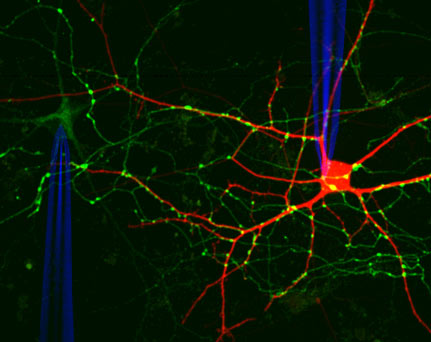
NEURONS FROM RAT HIPPOCAMPUS VISUALIZED USING FLUORESCENT TRACERS

“A typical neuron in the mammalian brain receives thousands of synaptic inputs and sends out information through thousands of output synapses. Experience alters the brain by making, modifying or eliminating these synapses. To facilitate the study of these processes in living brain tissue, the individual parts of the neuron can be labeled using fluorescent proteins. In this image, one neuron is labeled in red using a cytosolic dye introduced through a microelectrode. Another neuron expresses a fluorescent presynaptic marker called VAMP-EGFP. The green puncta are individual synapses (each synapse is around 1 micron in size), some of which can be seen contacting the red neuron. In this experiment, we also recorded electrical activity in the neurons using the patch-clamp method – the glass microelectrodes can be observed contacting the cell bodies of two neurons. The elaborate dendrites and presynaptic boutons highlight the complexity of connections in the brain.”

Source: Murthy Lab

NMR STRUCTURE ENSEMBLE OF THE MURINE LEUKEMIA VIRUS MRNA READ-THROUGH PSEUDOKNOT

The MLV pseudoknot is protonated at A17 (red) to induce formation of the active structure in which loop 2 (green) engages the RNA double-helix (blue and grey) in a regulated proportion of mRNA molecules. The distribution correlates with the recoding frequency observed in vivo, providing a mechanism for read-through stimulation.

Source: D’Souza Lab

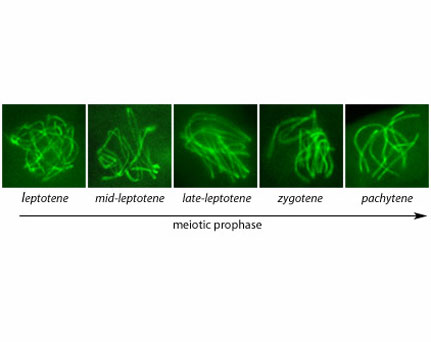
PROGRESSIVE RECOGNITION AND JUXTAPOSITION
OF HOMOLOGOUS CHROMOSOME AXES

“Progressive recognition and juxtaposition of homologous chromosomes during meiosis. Chromosome axes of the filamentous fungus Sordaria macrospora as illuminated by fluorescently-tagged axis protein (Spo76-GFP). (In collaboration with Denise Zickler, U. Paris-Sud, Orsay, France). Pre-synaptic coalignment (leptotene) followed by synapsis (zygotene, pachytene).”

Source: Kleckner Lab

RNAI DEPLETION OF PLK1 BLOCKS ANAPHASE

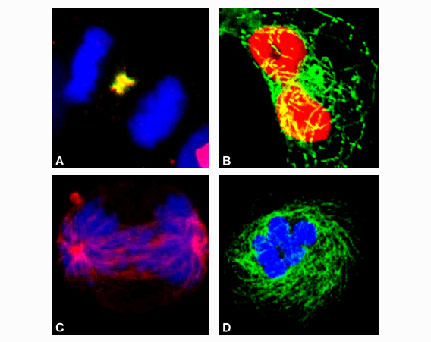
“The protein kinase, Plk1, concentrates on the central spindle during anaphase in mammalian cells. (A. Mol Cell Biol., 1995, 15, 7143; Oncogene, 2004, 23, 763).

RNAi depletion of Plk1 blocks anaphase completion with unseparated chromosomes. (B. PNAS, 2002, 99, 8672).

RNAi depletion of NudC (C. Dev Cell, 2003, 5, 127) and MKLP1 (D), two Plk1 substrates, induces chromosomes lagging (C) and cytokinesis failure (D).”

Source: Erikson Lab

SPERM COOPERATION IN DEER MICE.

Sperm from highly promiscuous deer mice (genus Peromyscus) form alliances. These sperm groups swim faster than individual sperm and thus have an advantage in the race to fertilize the female ova. Using fluorescent labeling, it has been possible to show that sperm from two different males (one labeled red, and one green) preferentially cooperate with related sperm — these mice can even discriminate against sperm from a full-sib littermate, which suggests a highly-refined (and yet undescribed) recognition mechanism at the level of sperm cells. This discriminatory behavior does not occur in a closely-related monogamous species, suggesting this complex behavior is driven by sexual selection.

Source: Hoekstra Lab

THE CIRCADIAN CLOCK FOUND IN CYANOBACTERIA CONTAINS A CORE PROTEIN CIRCUIT

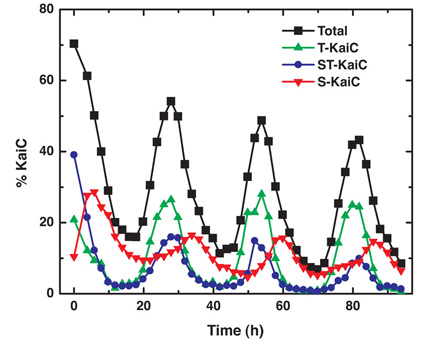
The circadian clock found in cyanobacteria contains a core protein circuit that can sustain robust 24 hour oscillations by post-translational interactions alone. This core oscillator can be reconstituted in a test tube using three recombinantly expressed proteins: KaiA, KaiB and KaiC. KaiC is an autokinase and autophosphatase that can be phosphorylated at two adjacent residues: S431 and T432. To study the role of multisite phosphorylation in this oscillator system, the abundance of each possible phosphorylated form of KaiC was quantified using mass spectrometry with isotopically labeled peptide standards during a 24 cycle of the oscillator. The plot shows the modification state of the pool of KaiC molecules in an oscillating reaction during three full cycles: KaiC phosphorylated only on T432 (green curve), KaiC phosphorylated only on S431 (red curve), KaiC phosphorylated on both sites (blue curve), and the total fraction of phosphorylated KaiC (black curve). Each form of KaiC peaks at a distinct phase of the reaction, indicating that circadian time is encoded by the phosphorylation state of KaiC.

Source: O’Shea Lab

THE JUNCTURE BETWEEN TWO MIGRATING BACTERIAL POPULATIONS

“Imaged are the interactions between cells from two different Proteus mirabilis strains (HI4320 in blue and BB2000 in yellow). In just a few hours, these two populations will have separated and a visible boundary will have formed between the populations. In contrast, swarms of the same strain do not give rise to a visible boundary and merge, indicating that P. mirabilis swarms are capable of territoriality and of self versus non-self recognition.”

Source: Gibbs Lab

TRANSGENIC EXPRESSION OF YFP

Transgenic expression of YFP in a bundle of axons that innervate neuromuscular junctions in an adult mouse. The red shows the acetylcholine receptors in the muscle membrane that respond the acetylcholine released by nerve terminals.

Source: Lichtman Lab

USING LINEAR MICRO-COLONIES TO FOLLOW PROMOTER ACTIVITY ACROSS GENERATIONS OF E.COLI

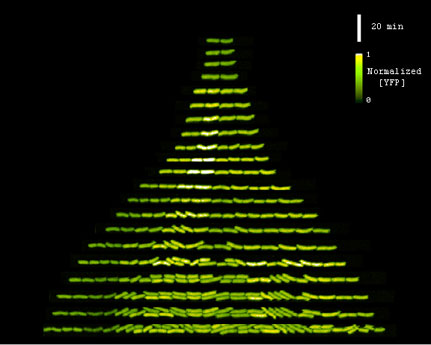
Genealogy in a micro-linear colony of the activity of the MAR (multi-antibiotic resistance) promoter in individual E. coliin response to a steady exposure of salicylate (1mM). The Venus yellow fluorescent protein reports the activity of this promoter as described in the original proposal. The concentration of Venus is calibrated using Fluorescent Correlation Spectroscopy and is color-coded from dark-green to white, which corresponds respectively to low and high level of expression of the reporter. Here we can visualize to what extent the activity of the MAR promoter, which governs resistance to antibiotics, is inherited from generation to generation.

Source: Cluzel Lab

VISUALIZATION OF ROD PHOTORECEPTORS WITH GFP IN TRANSGENIC ZEBRAFISH

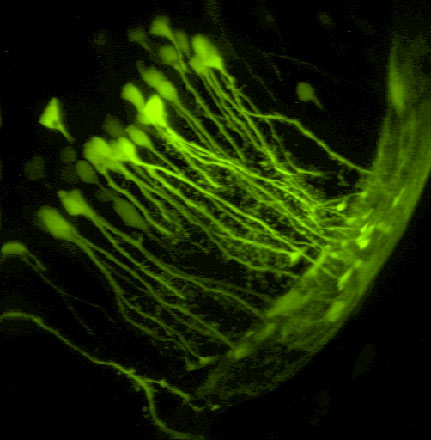
“The vertebrate retina is an accessible part of the brain that consists of 7 major cell types arranged in multiple layers. A number of molecular pathways and signaling molecules are required to generate this cellular diversity. To facilitate the understanding of these processes, forward genetic screens in zebrafish have been perfor med to identify mutations that disrupt neurogenesis of the retina. Zebrafish that express a rod photoreceptor specific GFP transgene have been integrated into this screen in order to directly identify mutants that affect the rods. This image shows a ventral view of a living transgenic zebrafish at 4 days of age with the rod photoreceptors expressing the GFP transgene (cells in green). As the animal continues to grow, this patch of cells will eventually expand and fill both the ventral and dorsal retina. Mutations affecting this process can be studied and the genes identified to understand how cells within the nervous system develop.”

Source: Dowling Lab

VISUALIZATION OF SYSTEMIC RNAI IN C. ELEGANS

“The left image shows an adult C. elegans hermaphrodite expressing GFP transgenes in the pharynx and the nuclei of body-wall muscle cells. The worms to the right express GFP in the pharynx and body-wall, but also express GFP dsRNA exclusively in the pharynx. This autonomous expression of dsRNA causes local and systemic silencing of GFP.”

Source: Hunter Lab

VISUALIZING A DNA TRANSLOCASE

The image is a sporulating bacterium with its membranes stained in red and its chromosomes in blue. The image shows a division septum (upper right) that has partitioned the bacterium into large and small compartments with DNA transversing the septum between the two. The green dot is a DNA translocase that forms a channel in the membrane and is responsible for pumping an entire chromosome across the septum into the small compartment.

Source: Losick Lab

XENOPUS TECTAL NEURONS TRANSFECTED WITH GFP

Bulk electroporation can be used to transfect several neurons in intact tadpoles with a protein of your choice (GFP in this case). Neurons can then be imaged in-vivo for several days and can in addition be targeted for patch-clamp recordings. This makes it possible to examine in detail the functional and morphological changes of individual neurons during the course of development as well as before and after the application of certain learning paradigms.

Source: Engert Lab

ZEBRAFISH NOTOCHORD

Flourescence micrograph image of a zebrafish embryo that was scatter-labeled with red and green flourescent proteins.The notochord and surrounding tissues are labeled.

Source: Schier Lab